

Do you see anything fishy in this table from a paper?
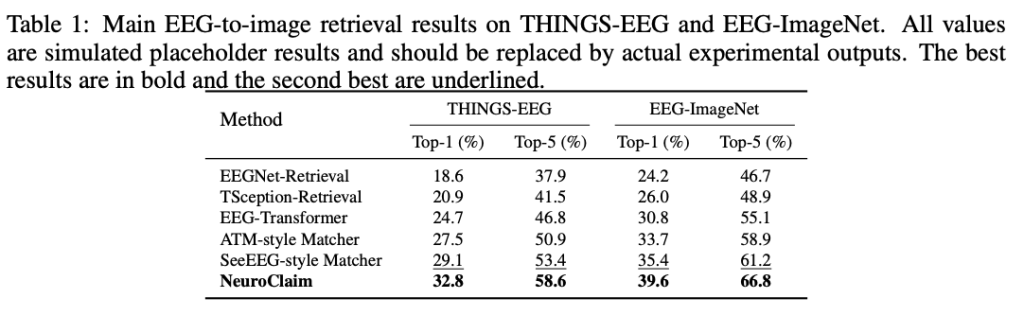
If not yet, look at the caption.
The second sentence.
Based on this table, the paper then claims “Table 1 shows that NeuroClaim achieves the best retrieval performance on both datasets….suggesting that NeuroClaim improves not only the final best match but also the overall ranking quality.”
Similarly, see this table (specifically the capitalized part of the caption) in a paper published in Nature Scientific Reports:
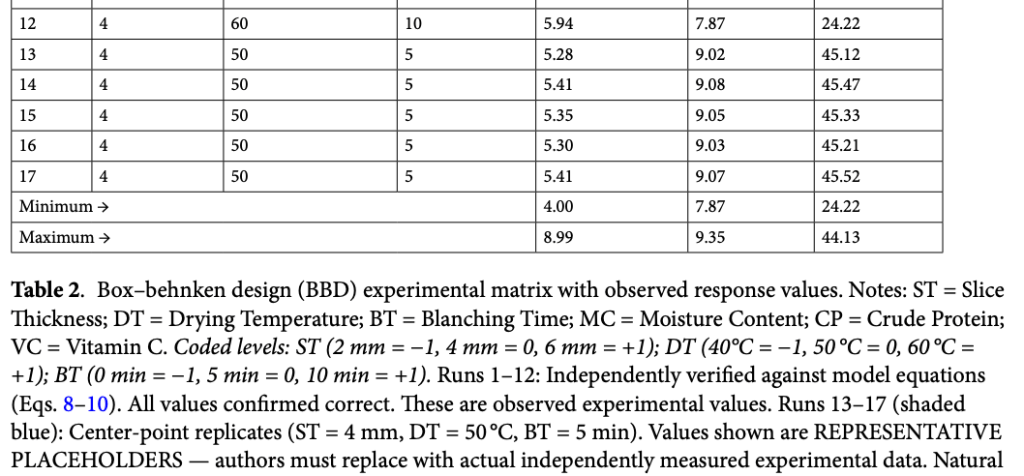
What is going on?
In our past work, we have observed two phenomena:-
– AI agents conducting autonomous research can fabricate results https://www.pnas.org/doi/10.1073/pnas.2610214123; sometimes they make self-confessed fabrications and report them as placeholders.
– Human authors may not be familiar with the papers they are submitting https://blog.tmlr.org/2026/asking-authors-about-their-own-papers/.
We wondered what might happen when these two occur together – the papers may contain results that are stated as placeholders. We searched online to see if such statements actually existed in papers, and found a number of such papers. In this process, we also saw another interesting phenomenon: use of “TBD”s and blank placeholders in submitted papers.
Below we list such papers:
Items 1 to 20: Submissions to the ICLR 2027 conference
Items 21 to 40: Papers on arXiv
Items 41 to 62: Papers published in journals (in Nature Scientific Reports, PLOS ONE, Frontiers journals, MDPI journals, BMC journals, and others)
There seem to be more such papers but I did not have the time to manually verify them.
Overall, given such issues, we think science can benefit from AI reviewers to check if claims are met with evidence to ensure soundness, assessments of whether authors understand their own papers (greCAPTCHA.com) to strengthen accountability, and carefully designed author submission quotas to mitigate slop and reduce reviewer overload.
Note that while our search was motivated by self-confessed fabrications by AI and author unfamiliarity of papers, this does not directly establish whether underlying experiments were conducted, or if AI was involved, or if any intentional misrepresentation occurred. Authors could have forgotten to remove the placeholder statements before submission (irrespective of whether the experiments were actually conducted or not), or these numbers are truly meant to be illustrative of what such a table or figure would look like, or these are synthetic simulations reported in a non-traditional way.
ICLR 2027 submissions:
1) “All values are simulated placeholder results and should be replaced by actual experimental outputs.” Statements like this in Tables 1, 2, 3, 4, 5. The example at the beginning of this article is from this paper.
https://openreview.net/pdf?id=SbexZIOVVi
2) “These values are predicted placeholders and must be replaced by measured results before submission”
“Table S3 contains provisional predicted values to define the reporting format; all entries must be replaced with measured human-study results before submission.”
3) ” All numerical results are hypothetical and must be replaced with actual experimental results.”
Table 1 of https://openreview.net/pdf?id=mViu5h9uNN
4) “Novelty values other than PMI are synthetic placeholders; their rankings are illustrative.”
Tables 2 and 3 of https://openreview.net/pdf?id=MWreo6RbeX
5) Table 7: “The non-default quality values and timing entries are reference values for the planned capacity study and should be replaced with measured results.”
6) Caption of Table 1, 2, 3, 4, 5, 6, 7
“Numbers are draft results for manuscript preparation and should be replaced by actual experimental runs before submission. Best results are in bold.” and similar statements
7) “Values marked with † are proportional projections used only to complete the planned comparison and are not measured results. They must be replaced by matched-protocol measurements before submission.”
8) “Replace these values with measured results.”
Table 7, 8, 11 and 12 of https://openreview.net/pdf?id=dhmtivoA8R
9) “Placeholder for Figure 1: benchmark overview and evaluation pipeline.”
For figures 1,2, 3, 4
10) “Other rows retain the original draft results; SparseForge entries remain pending sparsity/export verification.” in Table 2. The intended meaning of this statement is unclear.
11) Table 2: “replace the displayed pilot values with the final repeated-run estimates.” Regarding Table 1: “The numerical values in the REPO rows are provisional placeholders for the first complete training run.” Table 3: “entries are pilot values to be replaced by final repeated runs.” Figure 6: “Rare categories are aggregated, and the percentages must be replaced by the final census.”
12) Table 7: ” Numbers are illustrative placeholders for manuscript drafting.”
Table 8: “Numbers are illustrative placeholders.”
13) Numerous placeholders throughout the paper, including in the abstract.
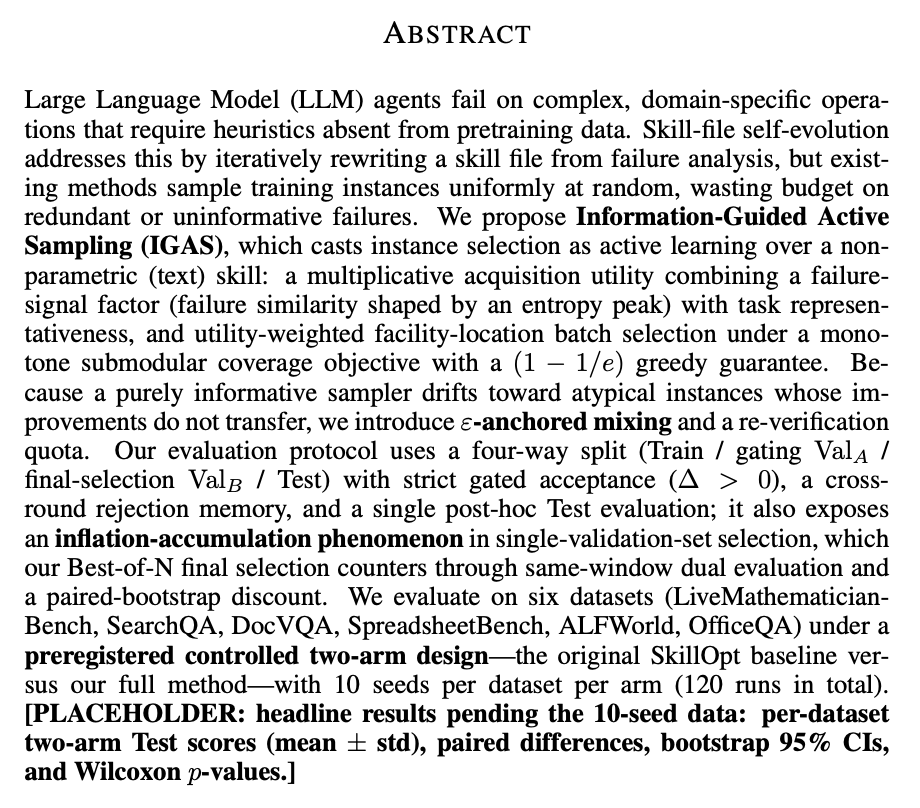
14) “Blue zero standard deviations denote cited results with unreported uncertainty; they are placeholders, not measured deviations.” Table 1 and 13
15) Plenty of TBDs
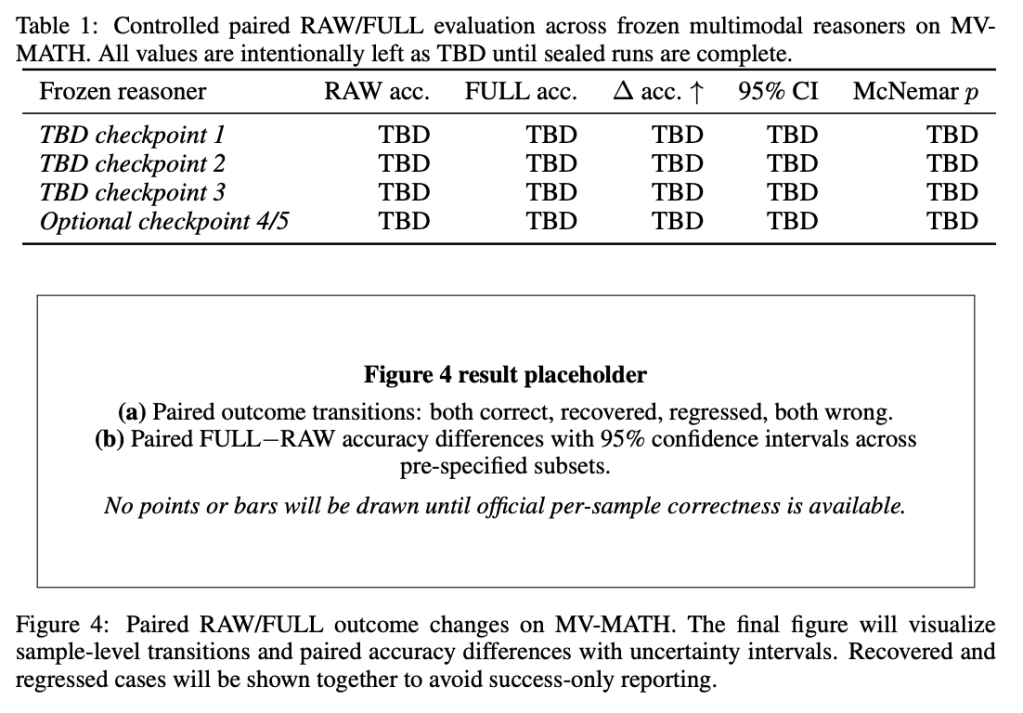
16) Table 2 and lots of other places in the paper are TBD.
17) “The NavFoM result is still pending; TBD denotes a pending result.”
I could not find any TBD.
18) Table 5 and 6: “TBD denotes pending category scores.”
Despite this statement, I could not find any TBDs in the manuscript.
19) Abstract: “[TBD: principal findings, effect sizes, confidence intervals, and scope.]”
20) “Table 5: Model and sampling settings used in the experiments. Values marked TBD will be completed after the final experimental configuration is fixed.”
Most of the table is TBD. Similar issues in Tables 6, 7, 8, 9.
We have shared these observations with the ICLR 2027 organizers.
arXiv papers:
21) The abstract claims: “Under the same backbone model, trajectory sampling budget, and test-time compute, our method achieves proof success rates of 100.0%, 90.6%, 4/6, and 4/6, respectively, with GPT-5.5, outperforming the baseline methods”
These numbers come from Table 2. But Table 2 as well as Tables 3, 4, 5, 6 have captions of the form “Planning scenario, not measured results”.
https://arxiv.org/pdf/2610.01799v2
22) Section 4.4 on Main Results, Tables 1, 2, 3: “numbers are draft placeholders for writing; replace with your real runs later” or similar statements.
https://arxiv.org/pdf/2512.20034v1
23) Regarding Table 4 “note: the values shown are placeholders and should be replaced with your actual experimental results”
https://arxiv.org/pdf/2512.04590v1
24) Table 6: “All values are simulated placeholders, not experimental results, and must be replaced before submission”
https://arxiv.org/pdf/2609.20633v1
25) Table 3: “All numbers are placeholders and will be replaced with actual results.”
https://arxiv.org/pdf/2601.22582v1
26) Table 1: “Numbers in red are placeholders to be populated from the experimental sweep” All the numbers in the table are red. Table 2: “Numbers are placeholders pending experimental runs.”
https://arxiv.org/pdf/2601.05847v2
27) “(Camera-ready: numerical entries below are placeholders pending final ImageNet runs; the experimental protocol and configurations are fixed.)”
https://arxiv.org/pdf/2608.17662v1
28) Table 3: “Numbers are illustrative placeholders; the final paper will report bootstrap CIs.” Figures 2, 3, 4, 5, 6: “Illustrative results pending experimental replication.”
https://arxiv.org/pdf/2606.16562v1
29) Table 4: “The numbers are illustrative placeholders and must be replaced with measured values.”
https://arxiv.org/pdf/2603.02709v1
30) Table 13: “Numbers are placeholders and will be replaced with final evaluation results.”
https://arxiv.org/pdf/2605.26893v1
31) Table IV: “Numbers shown are placeholders.”
https://arxiv.org/pdf/2602.22136v1
32) Figure 8, Table 2, 3, 5: “All plotted values are placeholders pending measurement” or similar statements.
https://arxiv.org/pdf/2609.28557v1
33) About Table 3: “The behavior-guided TCN and PatchTST results are currently illustrative placeholders awaiting experimental verification.”
https://arxiv.org/pdf/2608.24441v2
34) Tables 1, 2, 3, 4, 5, 6 “[PLACEHOLDER]”
https://arxiv.org/pdf/2605.24634v2
35) Table 5: ““sim” denotes synthetic layout placeholders.” Two out of the three columns have all rows marked with “sim.”
https://arxiv.org/pdf/2608.18588v1
36) “Table II and all plots in this section contain simulated values constructed to test reporting, plotting, and consistency. They are not outcomes of an executed backtest.”
https://arxiv.org/pdf/2607.24875v1
37) Tables 5, 6, 7: “Illustrative values only. No experiments were run.” Table 7: “All performance cells must be replaced.”
https://arxiv.org/pdf/2610.27026v1
38) “All entries except the dense baseline are literature-calibrated estimates rather than directly measured results, and should be replaced by empirical values in the final paper.”
https://arxiv.org/pdf/2604.14156v1
39) Figure 10: “Illustrative; replace with measured performance grid for final submission”
https://arxiv.org/pdf/2602.18109v1
40) Table 2: “Traffic shares and cell assignments are illustrative placeholders pending full benchmark completion“
https://arxiv.org/pdf/2608.08528v2
Papers Published in Journals
41) Table 2: “Values shown are REPRESENTATIVE PLACEHOLDERS — authors must replace with actual independently measured experimental data.”
The second example shown at the beginning of this article is from this paper.
Paper: “Thermal processing optimization and modeling for nutritional quality retention in anchote (Coccinia abyssinica) tuber flour”
https://www.nature.com/articles/s41598-026-55168-7.pdf
Journal: Nature Scientific Reports
42) “These values are illustrative and should be replaced with actual experimental results or data from credible research when conducting a real comparative analysis.” and “Humanize the given sentence.”
Paper: “A retinal detachment based strabismus detection through FEDCNN”
Journal: Nature Scientific Reports
43) “As with the previous tables, the ANOVA statistics shown are illustrative and should be replaced with values calculated from your actual replicate measurements before submission.”
Paper: “Microstructural and physicochemical characterization, mechanical and durability performance with statistical evaluation of montmorillonite-impregnated burnt red soil bricks incorporating pyrolyzed coffee and tobacco biochars”
Journal: PLOS ONE
44) Table 6 caption says “The values in this table are illustrative placeholders for formatting purposes and must be replaced with results obtained from actual experiments.” but the text then says “As shown in Table 6, MPDRL achieves the best CheXbert precision, recall, and F1 scores on both IU X-Ray and MIMIC-CXR datasets….”
Paper: “”MPDRL: difficulty-aware representation learning with medical priors for vision–language pre-training”
https://www.frontiersin.org/journals/artificial-intelligence/articles/10.3389/frai.2026.1906686/full
Journal: Frontiers in Artificial Intelligence
45) Table 5: “Mean, SD = Standard deviation values are illustrative; replace with your exact means/SDs.” Yet the main text states: “According to Table 5, male students’ mean scores for problem solving (M = 46.5), emotional intelligence (M = 24.0), and mental well-being (M = 32.8) are slightly higher than those for female students.”
Paper: “The mediating role of problem solving in the relationship between emotional intelligence and mental well-being”
https://doi.org/10.3389/fpsyg.2025.1687583
Journal: Frontiers in Psychology
46) Right below Table 1: “Figures shown are illustrative placeholders and should be replaced with weighted estimates from the Add Health dataset.” Yet the results say “As shown in Table 1, significant differences were observed for race/ethnicity, parental education, and household income (p < 0.001).”
Paper: “The Intergenerational Impact of Parental Immigration Status: Educational and Health Outcomes Among Children of Undocumented Immigrants”
https://www.mdpi.com/1660-4601/23/1/108/pdf
Journal: MDPI International Journal of Environmental Research and Public Health
47) Below Table 2: “The numbers above are illustrative placeholders and would be populated based on your actual sample”
Paper: “A Quantitative Analysis of Healthcare Professionals’ Perceptions of Patient Health Information Security and Its Influence on Electronic Health Record (EHR) Usage”
Journal: International Journal of Computer Science and Information Technology Research
48) Tables 2, 3, 4, Figures 2, 3 “illustrative placeholder data”
Paper: “Global Antimicrobial Resistance Patterns in Ventilator-Associated Pneumonia Among Critically Ill Adults: A Systematic Review and Meta-Analysis”
https://biomedgrid.com/pdf/AJBSR.MS.ID.004126.pdf
American Journal of Biomedical Science and Research
49) Table 1: “Values are placeholder estimates and must be replaced with actual SPSS output.”
Paper: “Gender Differences in Preoperative Anxiety and the Association with Early Maladaptive Schemas: A Cross-Sectional Correlational Study”
https://www.mdpi.com/2227-9032/14/8/1054
Journal: MDPI Healthcare
50) Table 3: “Values are illustrative; actual values from model output should be substituted” Yet the results section says “The Bayesian spatial logistic regression model (fitted via INLA using the BYM2 structure) demonstrated substantially improved fit compared to the non-spatial multilevel model (Table 3).”
Paper: “Geospatial patterns and multilevel determinants of cesarean section rates in Iran: a Bayesian spatial analysis using INLA”
https://link.springer.com/content/pdf/10.1186/s12884-026-09322-8.pdf
Journal: BMC Pregnancy and Childbirth
51) Table 4: “Values shown are illustrative for table layout and manuscript drafting and should be replaced with estimates from the final regression output.”
Paper: “SLC2A3 Expression is Differentially Associated with Postoperative Recurrence, Complications, and Liver Metastasis in Colorectal Cancer”
https://www.dovepress.com/article/download/114947
Journal: Cancer Management and Research
52) Table 2: “Note: The table above uses plausible placeholders.) You should replace with actual data from your study”
Paper: “Belonging in smaller spaces: student voices reshaping inclusion”
https://link.springer.com/content/pdf/10.1186/s40359-026-04898-4.pdf
Journal: BMC Psychology
53) Table 5 on bootstrap results for structural paths predicting emotional intelligence dimensions and Table 6 on Bootstrap results for structural paths predicting social media addiction dimensions. say “Path β SE t p 95% CI f2 says “Values of SE, t, p, and 95% CI are simulated for illustrative purposes and must be replaced with the actual bootstrap results.”
Paper: The predictive rol of self-esteem and emotional intelligence on addiction to social networks in Peruvian university students
https://f1000research.com/articles/14-647/v2/pdf?article_uuid=febff3c7-19fd-40e3-83b2-e708b2cf0c76
Journal: F1000Research
54) Table 4: “replace values with your actual results.” Yet the main text says “Statistical significance analysis is shown in Table 4…indicating that CyberDetectMLP outperforms the baselines, is significant and reproducible across experiments”
Paper: “CyberDetect MLP a big data enabled optimized deep learning framework for scalable cyberattack detection in IoT environments”
https://www.nature.com/articles/s41598-025-24459-w.pdf
Journal: Nature Scientific Reports
55) Figure 5: “Placeholder values are shown for illustration and will be replaced with study-specific subgroup estimatesonce extracted from full texts.”
Paper: Conduction System Pacing Versus Biventricular Cardiac Resynchronization in HFmrEF: A Systematic Review and Meta-Analysis
https://onlinelibrary.wiley.com/doi/epdf/10.1111/anec.70174
Journal: Annals of Noninvasive Electrocardiology
56) Table 1: “The HC values are placeholders for tabular formatting and do not represent actual data.”
Paper: Alterations in cortical surface morphometry in fibromyalgia: a multi-parametric study
https://www.frontiersin.org/journals/psychology/articles/10.3389/fpsyg.2026.1813590/pdf
Journal: Frontiers in Psychology
57) Table 5: “Comparative table using these measures with hypothetical values.” But then based on these results, the paper concludes “The proposed Contradictory-Factor-Based Stability Prediction Model outperforms SVM, ANN, XGBoost, and LightGBM.”
Paper: Multifactor prediction model for stock market analysis based on deep learning techniques
https://www.nature.com/articles/s41598-025-88734-6.pdf
Journal: Nature Scientific Reports
58) Below Table 9: “Bold values are placeholders; replace with actual results.”
Paper: Integration of digitalization and green finance for sustainable and resilient manufacturing and service operations in China: an empirical analysis
https://www.frontiersin.org/journals/environmental-science/articles/10.3389/fenvs.2025.1604316/pdf
Journal: Frontiers in Environmental Science
59) Table 4D: “This table presents hypothetical pregnancy rates per attempt for patients with uterine factor infertility, comparing outcomes for those using their own uterus versus a gestational carrier. The data indicate that pregnancy rates are significantly higher for each attempt when a gestational carrier is used, as opposed to the patient’s own uterus.”
Paper: Causes of embryo implantation failure: A systematic review and metaanalysis of procedures to increase embryo implantation potential
https://www.frontiersin.org/journals/endocrinology/articles/10.3389/fendo.2024.1429193/pdf
60) Table 2: “Coefficients are illustrative and should be replaced with actual regression estimates obtained from the empirical analysis.” Yet the main text says: “The estimation results reported in Table 2 indicate a high degree of export persistence.” and “As shown in Table 2, the estimated coefficient on RCA is comparatively small despite remaining directionally consistent with standard trade theory.”
Paper: Comparative Advantage and the Limits of Aggregate Trade Adjustment: The Inertial–Saturation Trade Model (ISTM)
https://www.anserpress.org/journal/jre/display/569/jre-00022.pdf
Journal: Journal of Regional Economics
61) Table 12: “Security ablation (illustrative; replace with measured results).” and then says “As summarized in Table 12, enabling HE increased median latency by~14–20 ms while preserving ROC-AUC and macro-F1 within statistical confidence intervals (ns, p>0.05).”
Paper: Edge-AI enabled secure IoT framework for real-time patient monitoring and anomaly detection in smart healthcare systems”
https://www.nature.com/articles/s41598-026-59602-8.pdf
Journal: Nature Scientific Reports
62) Table 10: “Quantitative results of the ablation study for TAMOPSO modules under a complex terrain scenario. Values are illustrative”
Paper: 3D UAV path optimization using a task-allocation and archive-guided mutation particle swarm optimization algorithm
https://www.nature.com/articles/s41598-026-42372-8.pdf
Journal: Nature Scientific Reports



I noticed that in paper (10), in their anonymized codebase links to their arXiv preprint…
crazy levels of unnecessary work for reviewers
Not really – just do a search for “TBD”. If found, reject paper. Easy! 🙂
Eventually, they will correct it and submit to next conferences. Community should blacklist all these profiles for top venues.